DuitnSen · The Satellite Portfolio

Why I Stopped
at Twelve Funds

How I ended up owning Nvidia four times without deciding to. What I kept, what I trimmed, and the honest receipt — with pro/cons — on every satellite that survived the cleanup.

Start with the confession Jump to comparison table
Read after the core

This page assumes the core thesis (VWRA / FWRA) is already decided. Satellites are the optional, small, eyes-open layer on top — money you can afford to watch fall 50% without touching the core underneath.

~20 min read · figures as of mid-2026 · re-verify before acting

5 things to take away

Before you buy a single thematic ETF

01

A good story ≠ a good investment

Rare earths, robotics, the internet — every story here is true. Every one of them still managed to underperform the boring all-world fund for years. Being right about the theme is only one of four things you need to be right about.

02

You already own the biggest names

Nvidia, Apple, Palo Alto, Eaton, TSMC — your all-world core holds all of them. A thematic fund mostly doubles your bet on the leaders and adds a volatile second tier. Check the overlap before you buy.

03

The fee gap compounds into real money

A 0.6% satellite on top of a 0.15% core sounds fine. Over twenty years on RM100,000, that 0.45% gap quietly hands over thousands in extra fees — whether the satellite wins or not.

04

Size it for the worst day, not the best story

Before you buy, find the worst drawdown the fund has ever done — REMX did −80%, 3119 did −34% in a year, GRID did −41%. Own only as much as you can watch fall that far without selling the core or losing sleep.

05

The Fresh Start Test is the real gatekeeper

If you didn't already own it today, would you buy it at this price — as money you could watch fall 50% without flinching? As a core holding: almost never. As a small, funded-from-surplus satellite: sometimes, with conditions.

Try it yourself

Run this test yourself — the ETF Overlap Checker at tools.duitnsen.com answers it in one click, with verified holdings data.

Open the ETF Overlap Checker ↗

How I got here

How I ended up with twelve thematic ETFs

Let me show you the portfolio first, because a confession without the receipts is just a humble-brag.

A Nasdaq 100 tracker. A broad semiconductor ETF. A second semiconductor ETF — just the chip designers. A third — just the Asian ones. A robotics-and-AI fund. An internet fund. A cybersecurity fund. A defence-technology fund. A smart-grid fund. A rare-earth fund. A Hong Kong tech fund. A Japan fund.

Twelve lines. I used to scroll that list with a quiet pride. It looked like the portfolio of someone who had a view. Chips, AI, robots, internet, defence, energy transition, strategic metals, the rising East. I wasn't just investing. I was curating the future.

That was the story. Here's the truer one: not one of those twelve buys was stupid at the moment I made it. And that is exactly what made it dangerous. Every airtight thesis was just the last one, dressed in different clothes. Add a Nasdaq tracker → chips are more focused → fabless is even purer → Asian supply chain is different → AI lives on the internet → cybersecurity is non-discretionary → the grid powers everything → rare earths power the grid → China tech is cheap → Japan is finally waking up.

The day I added it up. One quiet weekend I started listing the top holdings of every fund side by side. Nvidia appeared in the semiconductor fund — fair. Then the fabless fund. Then the robotics fund. Then the Nasdaq tracker. Four funds. One company. I had not once decided to own a large Nvidia position. I had built one by accident, through the back door, four times over, at four different expense ratios. The word "diversification" curdled in my mouth. I had been using it to mean "I own a lot of different funds." What it actually means is "I own a lot of different outcomes." Those are not the same thing.

The thematic funds were charging 0.5–0.68% each. A plain all-world fund charges 0.15%. I was paying a narrative tax — a premium for the story — on overlapping exposure to the same handful of companies. Paying extra to be less diversified than I thought I was.

I sold CNDX, SMH, SMHX, and folded the money into one all-world core. Then I sat down and worked out which satellites were genuinely different — different engine, genuinely additive, not duplicate — and built the fences around them. What you see below is what survived.

All satellites compared

The full receipt

Sorted by theme/region. Status reflects author's current position — not a recommendation. All figures as of mid-2026; verify current details on FSMOne and fund factsheets before acting.

Ticker Theme What it is TER Wrapper Additive to FWRA? Status
BOTZ Tech / AI Robotics & AI, ~50 stocks, 50% US + 25% Japan 0.68% US-listed Partial — Japanese industrials are additive; Nvidia is already in core Frozen · not adding
PNQI Tech / Internet Internet economy, ~79 stocks, Alphabet/Amazon/Apple/MSFT/Meta top 44% 0.60% US-listed ~99% already in FWRA — near-pure duplication Kept with rules
BUG Tech / Cybersecurity Cybersecurity software, ~30 stocks, 87% US 0.50% UCITS preferred Partial — platform leaders in FWRA, smaller names are new exposure Kept · profits only
3119 Tech / Chips Asia chip manufacturing, 40 stocks, Taiwan/Korea/Japan/China 0.68% HK-listed Yes — genuinely additive manufacturing layer Kept · conviction
GRID / FGRD Infrastructure Smart grid, ~109 stocks, 63% Europe, ABB/Eaton/Schneider 0.56–0.63% UCITS preferred Yes — global industrials, low overlap with all-world Kept
SHLD Defence Defence tech, ~50 stocks, 87% traditional industrials 0.50% US-listed / UCITS alternatives exist Partial — Rheinmetall, Hanwha less represented in FWRA Kept · review scheduled
REMX Commodities Rare earth / strategic metals, ~30 stocks (more lithium than RE) 0.53% US-listed Partial — adds commodity miners not in FWRA Trimmed hard
3067 Regional / China Hang Seng TECH, consumer platforms (Tencent, Alibaba, Meituan) 0.25% HK-listed Adds deliberate China overweight (already in FWRA, but at low weight) Monitoring · −20%
XDJP Regional / Japan Nikkei 225, price-weighted, 225 Japanese companies 0.09% UCITS (Luxembourg) Adds Japan overweight (FWRA holds ~5–6% Japan) Comparison lesson

*Overlap assessments are approximate and by weight. Run your specific holdings through wisesheets.io or justETF for precise figures. Fees, holdings and status change — verify current details before acting.

⚠ Educational material only — not financial advice, not a recommendation to buy or sell. Every holding shown is a satellite in a specific personal context: small, surplus-funded, sized for the worst drawdown, with a written exit. Your context is different. ETF investing carries risk; values fall and there is no guaranteed return like ASB or Tabung Haji. Sector and thematic ETFs are higher-risk than a broad core. Verify all figures with FSMOne and the fund provider before acting. DuitnSen is not licensed under the Securities Commission Malaysia.
First: the core thesis (VWRA / FWRA) → The portfolio framework → The fee maths →

The framework

What a satellite has to pass to stay

Rule 1

Size it for the crash, not the dream

Find the fund's worst drawdown — real, historical. Own only as much as you can watch fall that far without touching the core or losing sleep. For most people that's a few percent of the portfolio.

Rule 2

Fund from surplus, never from core

A satellite is only funded from business profits or genuine spare money. The core DCA is never paused or starved to feed the exciting bet. The core eats first. Always.

Rule 3

Write down the exit before the entry

A stop level and a review date, decided while calm — not while emotional. Conviction with no exit is just stubbornness with better PR.

Rule 4

Never let a satellite become the core

A position that doubles starts to feel important, and important positions start running your emotions. Check on a schedule that your risky 5% hasn't quietly grown into a risky 20%.

The Fresh Start Test. The single question that cuts through every good story: If I didn't already own this today, would I buy it at this price — as a small satellite I can afford to watch fall 50% without flinching? As a core: almost always no. As a small satellite with money I've made peace with losing: sometimes. The test decides — not the chart, not the headline.

Before you buy

Put the test in writing before you act. The Decision Journal + Portfolio Guard at tools.duitnsen.com logs the buy against your own house rules and forces you to name a falsifiable exit — before the money moves, not after.

Open the Decision Journal ↗

Every satellite below is reviewed against these rules. The pro/cons are balanced by design. My position (where I have one) is flagged in a gold callout — it is one data point, not advice.

🤖

Satellite category

Technology & AI

The most seductive category — and the most overlapping with your all-world core. Before adding any tech satellite, check how much of it already sits in FWRA/VWRA at full market-cap weight.


BOTZ

FROZEN · NOT ADDING Global X Robotics & AI ETF · US-listed · 0.68% TER Additive to FWRA? Partial — Japanese industrials are additive; Nvidia is already in your core

About 50 companies at the intersection of robotics and artificial intelligence. Unique mix: ~50% US names (Nvidia, Intuitive Surgical) + ~25% Japanese industrials (Keyence, Fanuc, Yaskawa). Not a pure US-tech bet — the Japanese industrial layer is genuinely exposure the all-world core underweights.

The case for it

  • Genuinely additive: Japanese robotics names (Keyence, Fanuc) are at fractions of a percent in the all-world core
  • Structural demand: ageing populations, labour shortages, reshoring — real, non-cyclical tailwinds
  • Humanoid robotics now a formal sub-theme — theme getting broader, not narrower
  • Quadrupling global robotics market forecast over next decade (multiple analyst sources)

The case against it

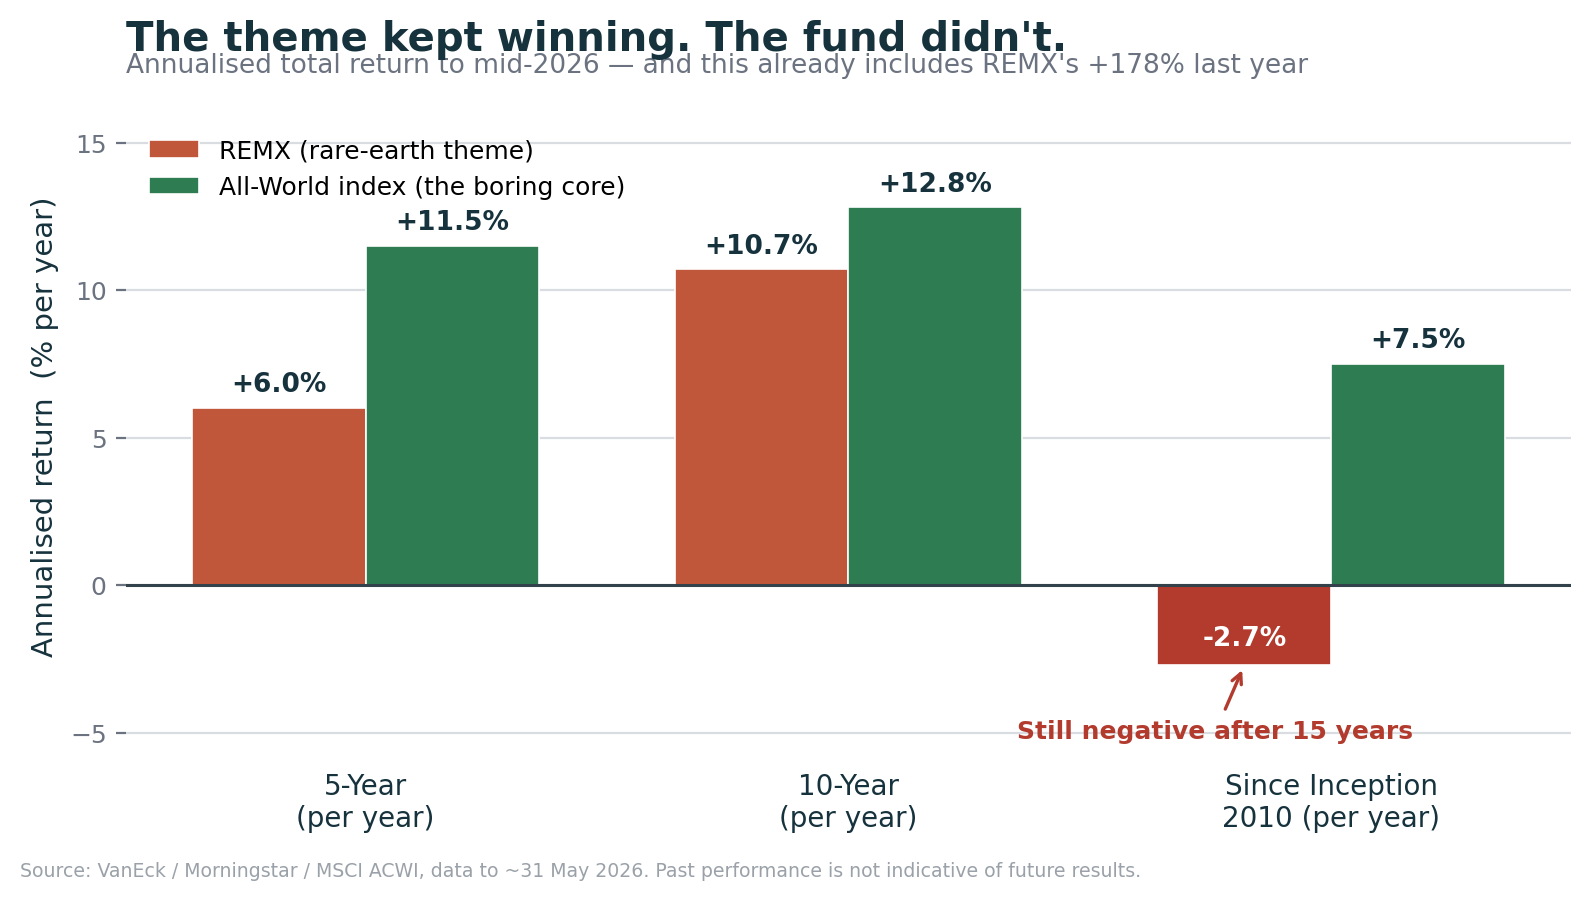
  • 5-year annualised return: +0.03% — basically flat through the entire AI/robotics boom
  • Timing risk: bought into an already-popular theme at peak valuation
  • US-listed: 30% dividend WHT (yield ≈ −0.09%, fee ate the dividend before tax could)
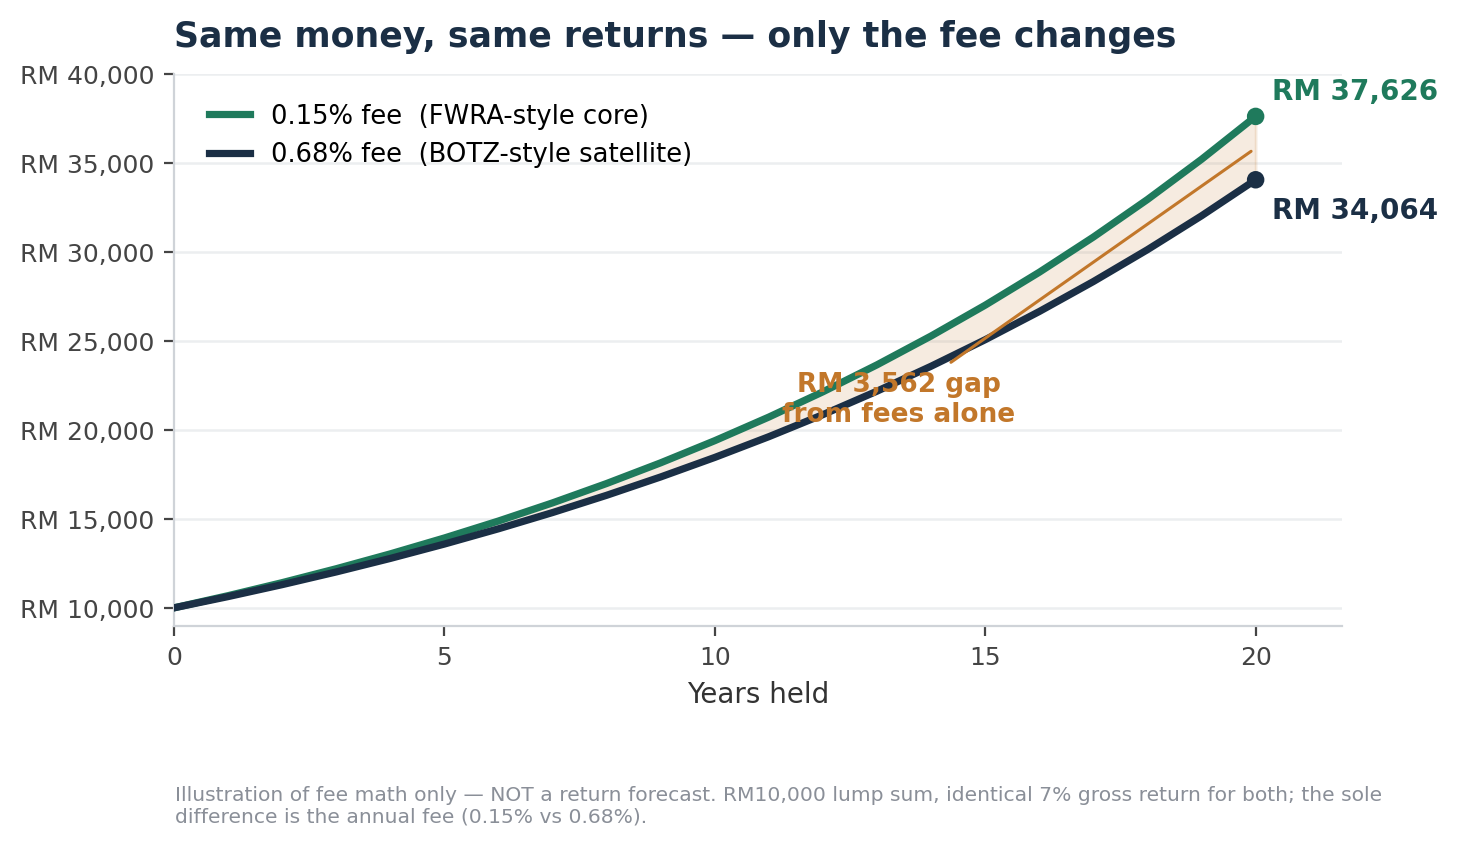
  • 0.68% TER = 4.5× the cost of FWRA/year
  • Fresh Start Test = no: would not buy fresh at this price and structure
My position I was right about robots. The theme is real. It still barely mattered. Five years of the most exciting industrial story on earth, and the fund went sideways — because I bought the future at a price that already assumed it had arrived. The position is now frozen: too small to justify the flat trading fee to sell, too honest to pretend I'd add more. It lives in my account as a reminder — not of being wrong, but of the gap between a real theme and a good entry.
Quick reference — BOTZ
Index trackedIndxx Global Robotics & Artificial Intelligence Thematic Index
DomicileUnited States (US-listed)
Holdings~50 stocks, non-diversified
TER0.68% / yr
Dividend yield≈ negative (fee eats it)
Worst drawdownSignificant — plan for −50%+
Performance (5-yr p.a.)+0.03% (to Mar 2026)
US estate tax?Yes — US asset
Fee drag: 0.15% vs 0.68% over 20 years on RM10,000 — RM3,562 gap from fees alone

PNQI

KEPT · WITH RULES Invesco Nasdaq Internet ETF · US-listed · 0.60% TER 
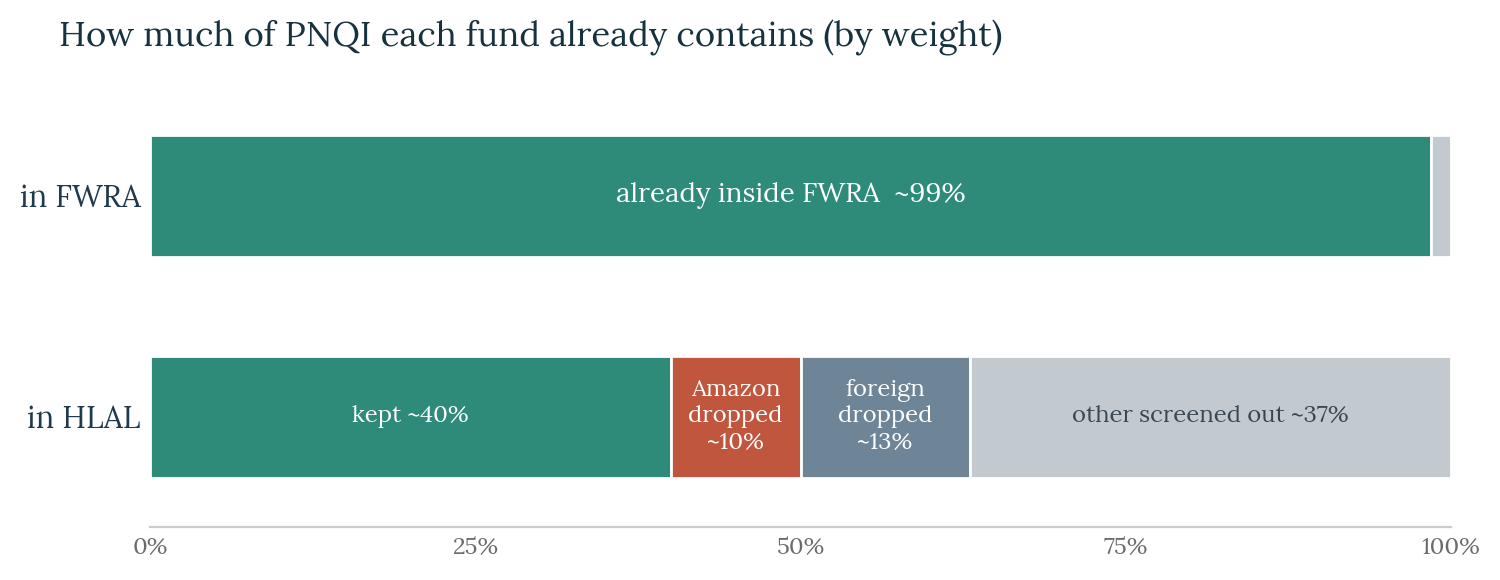
Additive to FWRA? ~99% already in FWRA — near-pure duplication

About 79 companies that earn their money from the internet: search, social media, e-commerce, streaming, cloud, online ads. Top 5 — Alphabet, Amazon, Apple, Microsoft, Meta — make up about 44% of the fund combined.

The case for it

  • The internet theme is genuinely structural — it reshaped commerce, media, and enterprise permanently
  • More internet-concentrated than a broad Nasdaq — different profile from the all-world core in terms of intent
  • Dividend yield ≈ zero → 30% WHT barely bites (growth companies reinvest, not pay out)
  • Running since 2008 — long track record

The case against it

  • ~99% of PNQI by weight already sits inside FWRA — almost pure duplication, not diversification
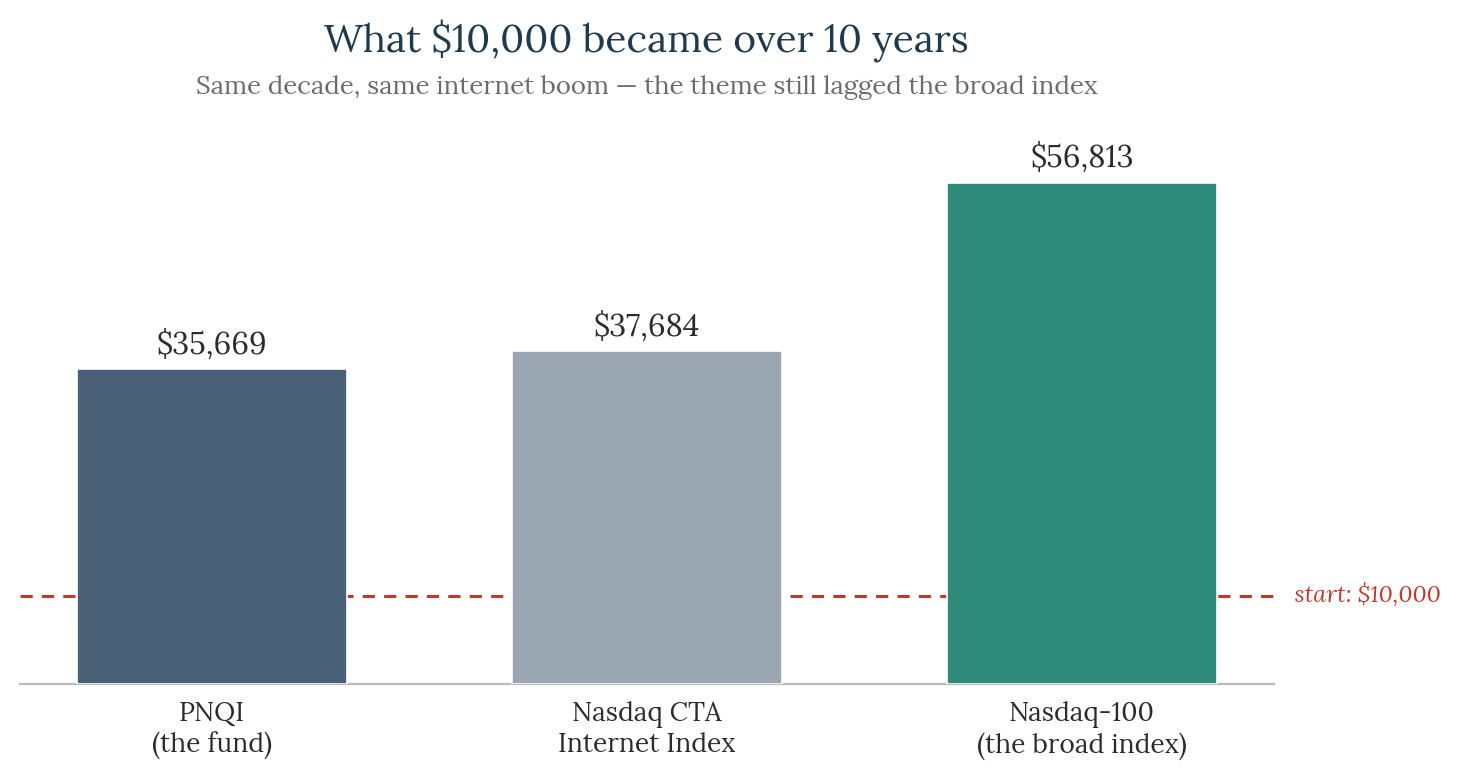
  • 10-year performance: $10k → $35,669 vs plain Nasdaq-100 → $56,813 — theme lagged the broad index
  • Even lagged its own index ($37,684) — 0.60% fee plus tracking friction
  • 4× the cost of FWRA for a fund you almost entirely already own
  • US-domiciled: US estate-tax exposure; no accumulating wrapper
My position The most overlapping satellite I hold — and I kept it knowing that. It passes the Fresh Start Test only as a small, fenced, surplus-funded side bet; it fails immediately as a core. I kept it because I can afford to be wrong about it, and "I can afford to be wrong" is the only honest framing a fund like this deserves. It is on a review date, and it's judged against the Nasdaq-100, not against zero. The overlap number (~99% in FWRA) was the most uncomfortable thing I found when I actually checked.
Quick reference — PNQI
What $10,000 became over 10 years: PNQI $35,669 vs Nasdaq-100 $56,813 How much of PNQI FWRA already contains: ~99% in FWRA, ~40% in HLAL
IndexNasdaq CTA Internet Index
Holdings~79 stocks
DomicileUnited States
TER0.60% / yr
Overlap with FWRA~99% by weight
Overlap with HLAL (Shariah)~40% (Amazon screened out, foreign names excluded)
10-yr return (own fund)$10k → ~$35,669
10-yr return (Nasdaq-100)$10k → ~$56,813

BUG

KEPT · BUSINESS PROFITS ONLY Global X Cybersecurity ETF · UCITS (London) or US-listed · 0.50% TER Additive to FWRA? Partial — platform leaders already in FWRA; smaller names are new exposure
Two versions, not the same fund. The US-listed BUG (NASDAQ) tracks Indxx Cybersecurity. The UCITS version (London: BUG LN, IE00BMH5Y871) tracks Indxx Cybersecurity v2 — ~30 stocks vs ~25, accumulating, no US estate-tax exposure. The UCITS version is recommended for long-term Malaysian holders even though the usual dividend-tax advantage barely applies here (near-zero yield).

About 30 cybersecurity software companies: Fortinet, Okta, Palo Alto, CrowdStrike, Akamai, Zscaler. ~87% United States, ~6% Israel. This is almost entirely an American software bet. Launched November 2021 — near the peak of the speculative tech bubble.

The case for it

  • Non-discretionary spending — companies cannot stop defending themselves even in a recession; attackers don't take economic downturns off
  • Permanently expanding attack surface: every new device, cloud workload and AI system is another door to lock
  • AI helps attackers — the same customers buy more defence. Both sides of the arms race feed the same budget
  • Market consolidation: fragmented point-solution vendors losing budget to platform giants inside this index
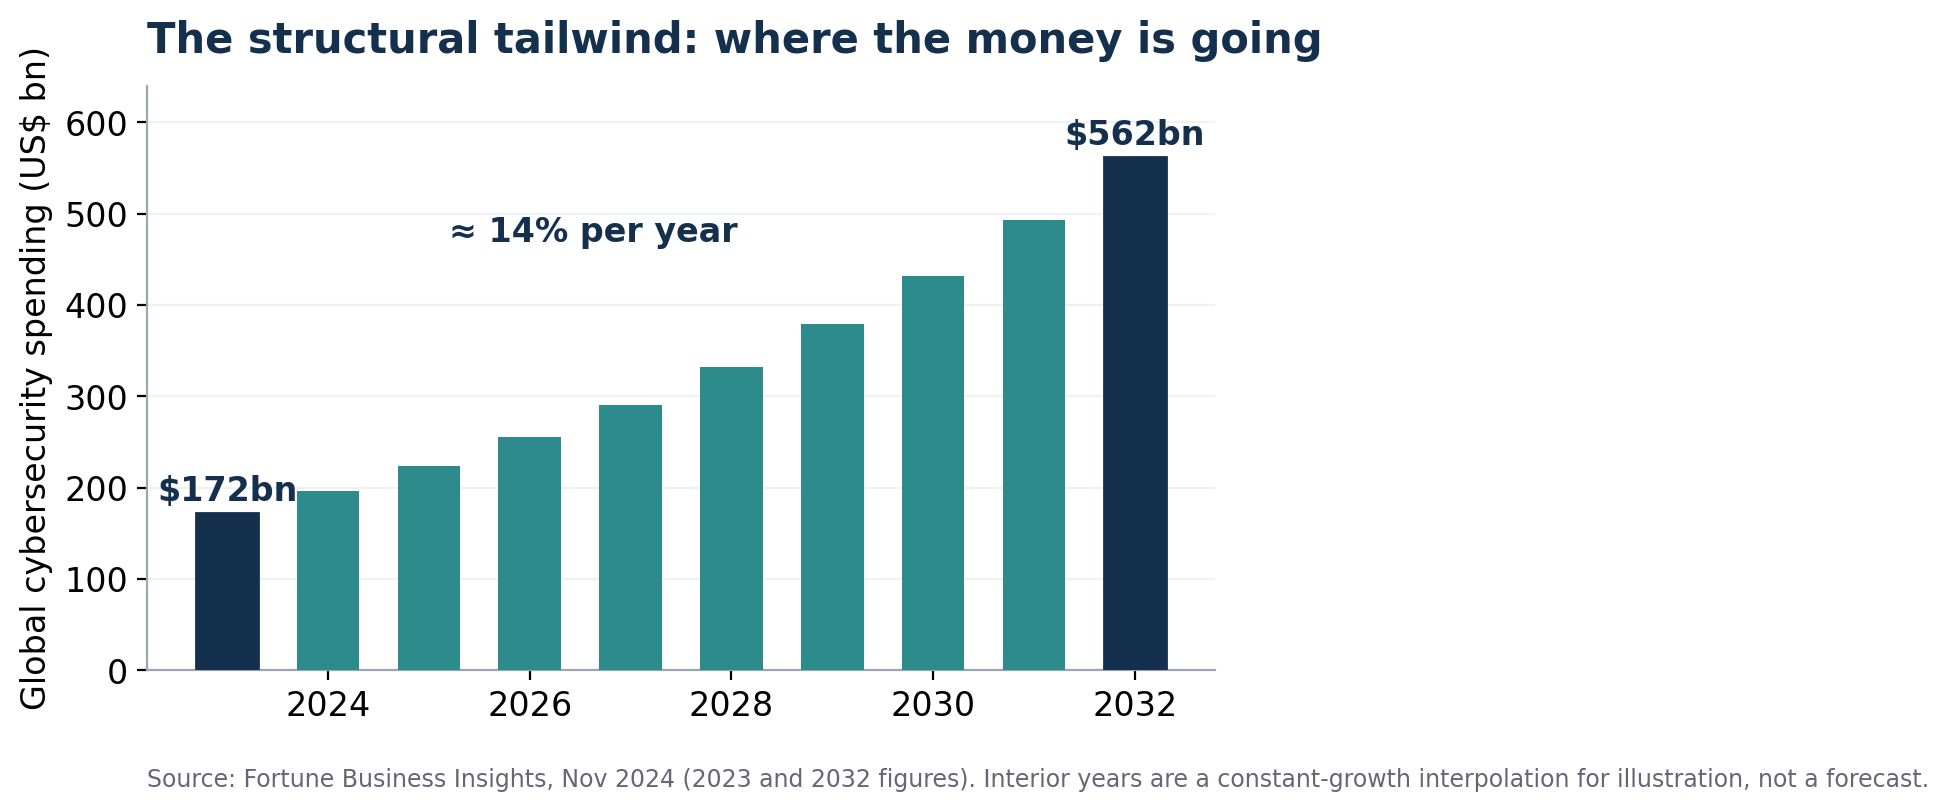
  • Global spending forecast: ~$172bn (2023) → $562bn (2032), ~14%/yr structural growth

The case against it

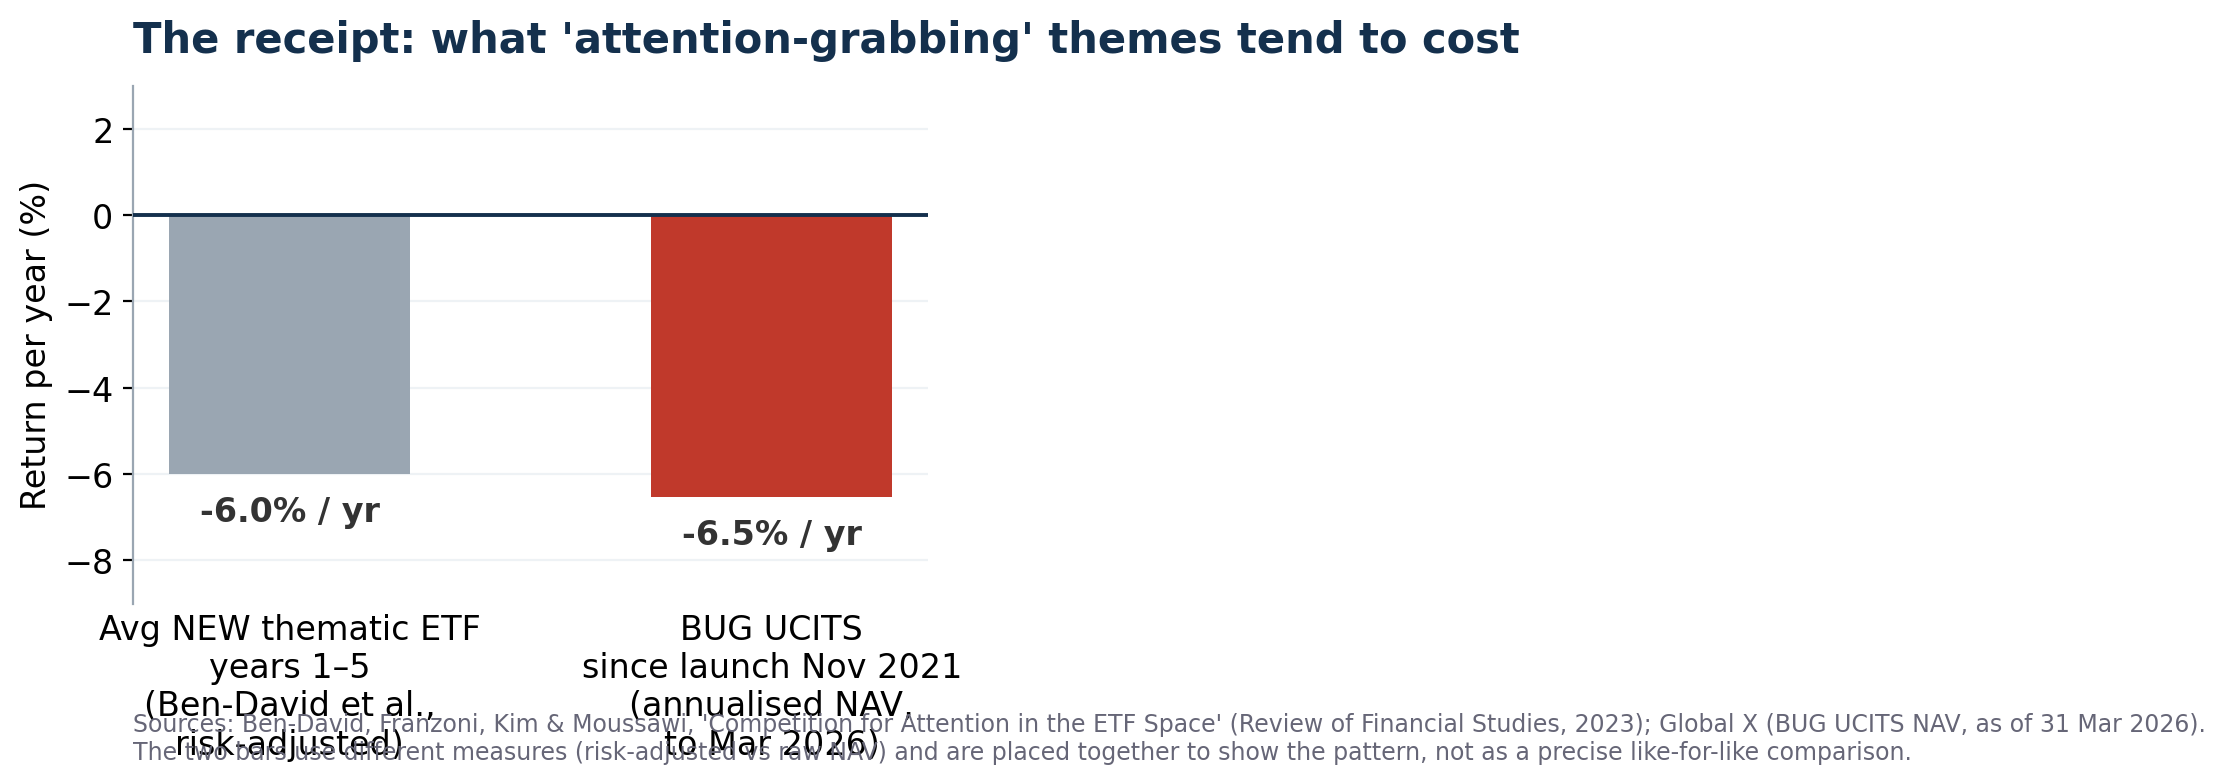
  • Launched November 2021 — near the speculative tech peak. Since launch: −6.5%/yr annualised (to Mar 2026)
  • Ben-David et al. (RFS 2023): thematic ETFs lose ~6%/yr risk-adjusted over first 5 years — BUG matches the academic average precisely
  • Biggest names (Palo Alto, CrowdStrike, Fortinet) already sit inside FWRA — adding BUG doubles the leaders, adds a volatile second tier
  • ~30 stocks, non-diversified, essentially 100% software — single bad earnings season for 2–3 names moves the whole fund
  • UCITS version: only ~$63m AUM, 2021 launch — thin and new, closure risk exists
  • 0.50% TER = 3× FWRA on a satellite that has lost money since launch
My position Cybersecurity is one of the few themes with a structural enough demand story to justify a small satellite. Non-discretionary spending plus an attack surface that only grows is a better foundation than most themes. But the receipts are honest: launched at the peak, down since, matching exactly what the academic research predicts for attention-grabbing thematic funds. I hold the UCITS version, funded only from business profits, never core savings. Sized so that going to zero is a footnote, not a chapter.
Quick reference — BUG (both versions)
Global cybersecurity spending: $172bn (2023) → $562bn (2032) The receipt: BUG UCITS −6.5%/yr since launch vs avg thematic ETF −6.0%/yr (Ben-David 2023)
BUG (US-listed)BUG UCITS (recommended)
ListingNASDAQLondon Stock Exchange (BUG LN)
ISINUS37954Y3844IE00BMH5Y871
DividendsDistributingAccumulating
US div. WHT30%15% (barely bites — yield ≈ 0.03–0.1%)
US estate taxYesNo
TER0.50–0.51%0.50%
AUM~US$0.9–1.2B~US$63M (tiny)
Since launch (annualised)−6.5%/yr (Nov 2021 to Mar 2026)

3119

KEPT · CONVICTION 
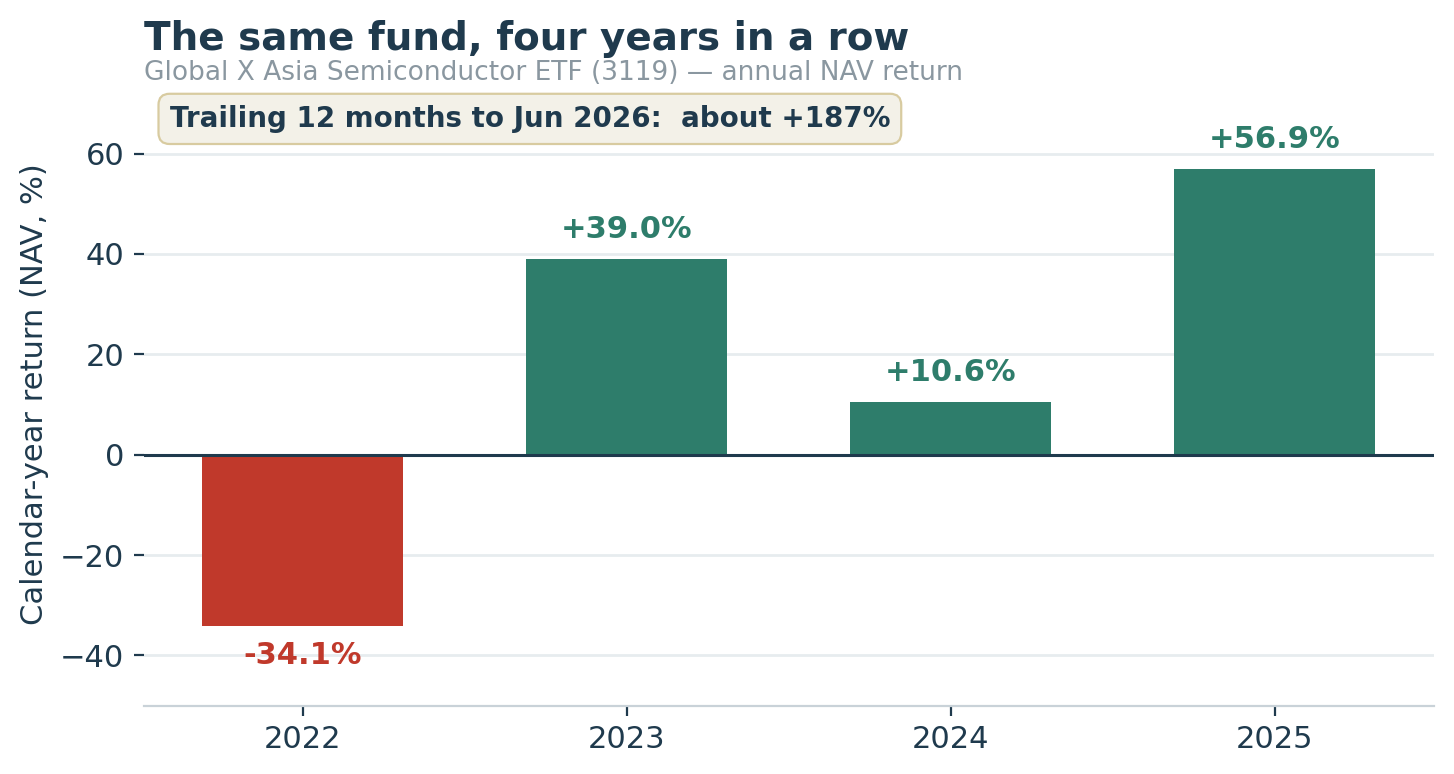
Global X Asia Semiconductor ETF · HK-listed · 0.68% TER Additive to FWRA? Yes — a genuinely additive Asia manufacturing layer

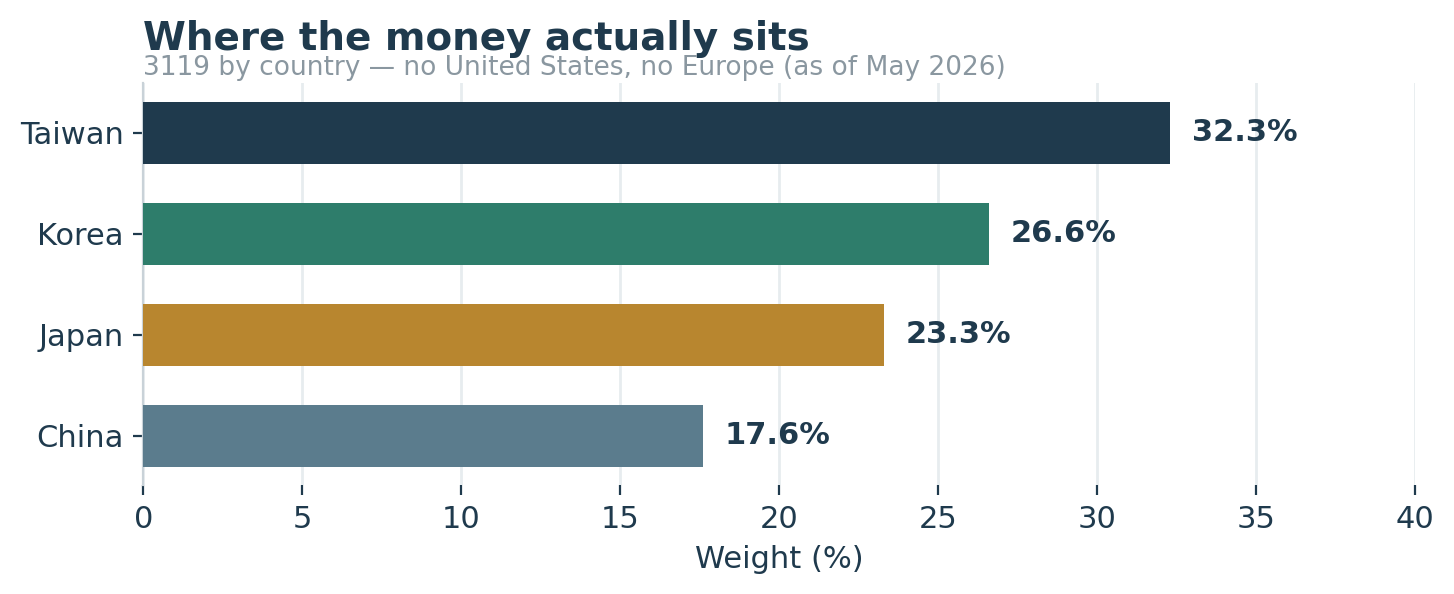
About 40 Asian companies that build chips rather than just design them: TSMC (foundry), Samsung and SK Hynix (memory), Tokyo Electron and Advantest (chip equipment), plus China's SMIC and Cambricon. Taiwan 32%, Korea 27%, Japan 23%, China 18%. No US. No Europe. This is the manufacturing end of the chip industry — the toll booths, not the cars.

The case for it

  • Genuinely additive, not duplicate. TSMC and Samsung sit in FWRA at ~1% weight each. SK Hynix, MediaTek, Tokyo Electron, Advantest — the manufacturing layer — are essentially absent from the all-world core at meaningful weight
  • Asia controls ~75% of world chip-making capacity; TSMC alone makes 70%+ of advanced chips
  • AI memory bottleneck (HBM chips) is a two-horse race between SK Hynix and Samsung — both inside 3119
  • Passes the overlap test: unlike CNDX, this is additive exposure, not a costume on what you already own
  • Four regional sub-bets that don't move in lockstep: Korean memory, Taiwanese foundries, Japanese equipment, Chinese substitution

The case against it

  • 91% one sector, top 10 = ~65% of the fund. A chip winter hits everything at once; nowhere to hide
  • −34% in 2022 — a single calendar year. Chip cycles are brutal and repetitive
  • +187% trailing 12 months to Jun 2026 — came after the recovery. Entry now is expensive
  • 0.68% TER = 4.5× the core every year
  • HK-domiciled, RMB underneath — the Ireland vs US WHT logic does not apply. Tax rules are different; verify with FSMOne directly
  • Small fund (~HK$1.1B); index was just changed in mid-2026 — worth monitoring what you own
  • Note: fund rules allow up to 50% in derivatives (currently physical, but permission exists)
My position The satellite I feel most confident about. The Asian manufacturing layer — TSMC's moat, SK Hynix's HBM monopoly, Tokyo Electron's equipment stranglehold — is a genuinely different engine from what my all-world core owns. 3119 survived the cleanup when SMH didn't because it's additive. But after +187% in a year, I am not adding — I'm watching. The Fresh Start Test for a new entry is now a harder yes than it was 18 months ago.
Quick reference — 3119
3119 by country: Taiwan 32%, Korea 27%, Japan 23%, China 18% 3119 annual NAV returns: 2022 −34.1%, 2023 +39%, 2024 +10.6%, 2025 +56.9%. Trailing 12mo +187%
Full nameGlobal X Asia Semiconductor ETF
ExchangeHong Kong Stock Exchange (FSMOne: 3119)
Holdings40 stocks · top 10 ≈ 65%
TER0.68% / yr
CountriesTaiwan 32% · Korea 27% · Japan 23% · China 18%
Domicile / currencyHong Kong · HKD / RMB
Worst year on record−34% (2022)
Trailing 12-month (to Jun 2026)~+187%
Fund size~HK$1.1B (relatively small)

Satellite category

Infrastructure & Energy Transition

GRID / FGRD / GRDU

KEPT First Trust Nasdaq Clean Edge Smart Grid Infrastructure · UCITS (London) or US-listed · 0.56–0.63% TER Additive to FWRA? Yes — global industrials, low overlap with all-world
Two versions. US-listed GRID (Nasdaq, 0.56% TER, ~122 holdings, larger/more liquid). UCITS twin: London-listed as FGRD (GBX) or GRDU (USD), ISIN IE000J80JTL1, 0.63% TER, accumulating, ~109 holdings. For a long-term Malaysian, FGRD/GRDU is structurally cleaner (accumulating, no US estate tax). Pick one — not both.

About 109–122 companies in electricity infrastructure: grid operators, transformer and cable makers, power management, smart-grid software. 63% Europe, 24% US, 9.6% Asia. Top names: Eaton, ABB (Switzerland), Schneider Electric (France), National Grid (UK), Prysmian (Italy), Johnson Controls, Quanta Services. This is the opposite shape from a US-tech satellite — a globally spread industrial basket.

The case for it

  • "Picks and shovels" for AI — own what every data center needs (power, wires) instead of guessing which AI model wins
  • The bottleneck has moved from chip to substation — grid buildout runs on decade-long timelines, demand is surging now
  • IEA: data-center electricity use could double to ~945 TWh by 2030; Goldman Sachs: 15%/yr US data-center power demand growth
  • Genuinely low overlap with all-world core — these mid-to-large industrials are in FWRA but at fractions of a percent. GRID is additive, not duplicate
  • Globally diversified (Europe 63%) — different risk shape from typical US-tech thematic

The case against it

  • Has already run hard — UCITS +42% trailing year, +77% over 3 years. Fresh Start Test matters most after a 40%+ move
  • USD 6.9bn of USD 11.5bn (US-listed) flowed in over the past year — a crowded trade: lots of money that bought high and hasn't sat through a drawdown
  • 1-yr beta ~1.06 — not a defensive utility holding. It moves with (and slightly above) the broader market, then adds single-theme risk
  • Rate-sensitive: infrastructure carries debt, and a "higher for longer" world hurts this basket more than broad equities
  • Policy-dependent: grid build-out needs permitting and subsidies — political shifts can slow the spend
  • Worst drawdown (US-listed since 2009): ~−41%. UCITS worst: ~−23%, but it's lived almost entirely in a bull run — this number is flattering
My position My picks-and-shovels bet. Own the wires everyone needs, not the robot that runs on them. The global industrial composition — ABB, Schneider, National Grid, Prysmian — is the reverse of my old Nasdaq mistake: genuinely different exposure, genuinely low overlap. I deliberately chose the UCITS version (FGRD) even though the dividend-tax advantage is smaller here than for my core (low yield). The accumulating wrapper and estate-tax protection are worth the 0.07% fee premium over the US version. Main honest risk: I bought it after the theme ran 40%, which the Fresh Start Test would make you slow down and examine.
Quick reference — GRID vs FGRD/GRDU
US-listed GRIDUCITS FGRD / GRDU (recommended)
ListingNasdaq (USD)London: FGRD (GBX) / GRDU (USD)
ISINUS-domiciledIE000J80JTL1 (Ireland)
DividendsDistributingAccumulating
US div. WHT30%15% (yield 0.2–0.8% — modest saving)
US estate taxYesNo
TER0.56%0.63%
AUM~USD 11.5B~EUR 2.2B
Launched2009Apr 2022
Holdings~122~109
Top-10 concentration~55% of fund
🛡

Satellite category

Defence & Security

SHLD

KEPT Global X Defense Tech ETF · US-listed · 0.50% TER · also see UCITS alternatives below Additive to FWRA? Partial — Rheinmetall, Hanwha are under-represented in FWRA
Note for Shariah investors and ethical investors: SHLD and its UCITS equivalents hold manufacturers of missiles, fighter jets, munitions, and weapons systems. This is a legitimate reason to exclude this entire category — on values grounds or Shariah screening grounds. That is a completely valid line to draw. If it's your line, skip to the next section.

About 50 defence companies. Despite being called "Defence Tech," the actual composition is ~87% traditional industrial (defence contractors) and ~13% information technology. Largest names: Lockheed Martin, RTX (Raytheon), Northrop, Boeing — plus European names: Rheinmetall, BAE Systems, Leonardo, and Korea's Hanwha. Palantir is the one genuine software name near the top.

The case for it

  • Global military spending hit ~US$2.7T in 2024 — sharpest yearly jump in decades (SIPRI). Forecast ~$3.7T by 2030
  • Government-contract driven — multi-year budgets, less consumer-cycle sensitivity
  • De-globalisation and bloc formation are structural, multi-decade tailwinds for defence budgets
  • More globally spread than most sector ETFs — Rheinmetall, BAE, Leonardo, Hanwha alongside US primes. If the next decade's growth is European and Asian rearmament, this is already positioned
  • Warfare is becoming a technology business (drones, AI, cyber) — gradually improving quality of names

The case against it

  • +52% in a year, ~51%/yr since launch (late 2023) — tripled in under 3 years. Much good news already baked in (PE ~25, PB ~4.7×)
  • Not really "tech" — ~87% traditional industrials. Don't pay tech-bubble prices for defence contractors
  • Policy risk: peace deals, fiscal constraints, election results, export restrictions can crack the thesis overnight
  • One-sector concentration, top-heavy — a handful of primes drive most of the movement
  • US-listed, but dividend yield ~0.35% → WHT difference ≈ 0.05%/yr (negligible). Real cost: US estate-tax exposure if position grows large
  • Values: holds weapons manufacturers — ethical/Shariah exclusion is legitimate
My position I believe the structural demand story — geopolitics, de-globalisation, defence tech — is real and multi-decade. The global composition (Rheinmetall, BAE, Hanwha) is what makes this different from a pure US bet. But I bought it after a tripling in price, which means a lot of the next decade may already be spoken for. Funded only from business profits, on a fixed review cadence, never promoted to core. I hold the US-listed version deliberately for this short-horizon satellite (low yield = WHT gap barely bites). If I were starting fresh and planning to hold for 15+ years, I'd take the UCITS version instead.
UCITS alternatives + quick reference

If you want the defence theme in an Ireland-domiciled wrapper (accumulating, 15% WHT, no US estate tax), three UCITS ETFs exist — each tracking a different index, so compare holdings before choosing. Don't hold multiple and call it diversification.

FundTickerTERStyleNotes
Global X Defense Tech UCITSARMR / 4MMR0.50%AccumulatingClosest cousin to SHLD, same issuer; Mirae index
VanEck Defense UCITSDFNS / DFEN0.55%AccumulatingLargest UCITS defence ETF; very concentrated
HANetf Future of DefenceASWC0.49%AccumulatingNATO-tilted index; broader spread
SHLD TER0.50%
Dividend yield~0.35%
1-yr return (to mid-2026)~+52%
Annualised since launch~51%/yr
Holdings~50 stocks, top-10 ≈ 62%
Sector mix~87% industrials, ~13% tech

Satellite category

Commodities & Strategic Resources

REMX

TRIMMED · HARD VanEck Rare Earth & Strategic Metals ETF · US-listed · 0.53% TER Additive to FWRA? Partial — adds commodity miners not in FWRA

About 30 companies in rare earths and strategic metals. But: by weight in early 2026, it held more lithium than rare earths — Albemarle, Pilbara, Ganfeng, SQM are lithium companies riding a different and badly beaten-down cycle. Also: China (~30%) is the largest country weight despite the thesis being "the West must break free of China." And there is now an ex-China rare-earth ETF specifically designed to fix that contradiction.

The case for it

  • Genuine structural story — EV motors, wind turbines, AI data centers, defence hardware all need rare-earth magnets
  • Supply is tight and heavily China-concentrated — geopolitical chokepoint that cannot be quickly replicated
  • West is actively funding alternative supply chains (MP Materials + DoD partnership, EU critical minerals strategy)
  • FSMOne research backed the theme with a price target ~17% above where it traded in early 2026
  • +178% in the year to mid-2026 — has delivered when the story was in favour

The case against it

  • Since inception 2010 (15 years): −2.7%/yr annualised — a day-one investor is still underwater after the best year in the fund's history (+178%)
  • The theme has been "obviously right" for 15 years and the fund still lost money. A true story ≠ a good investment
  • Not actually a rare-earth fund by weight — lithium dominates the portfolio
  • ~30% China exposure contradicts the core anti-China-dependency thesis
  • US-listed, distributing, 30% WHT on dividends, no accumulating wrapper
  • ~30 stocks, non-diversified, has historically done −80% drawdowns. Commodity cycles are brutal
  • ~55% of REMX by weight already sits inside your all-world core — the other half is commodity miners the core underweights, but that half is still a story bet, not a different engine
My position REMX taught me the sharpest lesson: a completely true story can still be completely the wrong investment. I was right about rare earths being strategic. The fund still compounded at −2.7%/yr over 15 years while the boring all-world index tripled. I trimmed hard after the +178% run — not because the theme is wrong, but because the FSMOne desk told me the quiet part out loud (take profits at this level, don't chase). What's left is pure satellite money: sized so an 80% crash, which this fund has genuinely done before, doesn't touch the plan.
Quick reference — REMX
REMX vs All-World annualised returns: 5yr +6.0% vs +11.5%, 10yr +10.7% vs +12.8%, since inception −2.7% vs +7.5%
Full nameVanEck Rare Earth & Strategic Metals ETF
ExchangeNYSE (US-listed)
Holdings~30 stocks, non-diversified
TER0.53%
China weight~30% (largest country)
Biggest metal by weightLithium > rare earths (early 2026)
1-yr return (to mid-2026)~+178%
Since inception 2010−2.7%/yr annualised
Historical worst drawdown~−80% (plan for it)
DividendsDistributing (US WHT 30%)
🌏

Satellite category

Country & Regional Bets

Regional satellites are different from thematic ones in one key way: the thesis rests on a country-level call, not a trend. That means you need to be right about the companies and the economy and the government and the timing. That's four separate predictions — and you probably only have real edge on one.


3067

MONITORING · −20% AT WRITING iShares Hang Seng TECH ETF · HK-listed · 0.25% TER (lowest in class) Additive to FWRA? Adds a deliberate China overweight (already in FWRA, but at low weight)

The 30-odd largest technology names listed in Hong Kong: Tencent, Alibaba, Meituan, BYD, Xiaomi, JD.com, Baidu. Not a pure AI fund — it does not hold the small, newly listed AI model developers whose prices exploded in 2026. It holds the mature consumer-facing platform businesses that use AI to improve what they already do.

"China AI" is two completely different trades. The hardware trade (CSI All-Share IT: 159939) — chip designers and server assemblers — was up ~47% in 2026; the orders had already arrived. The platform trade (3067) — consumer giants — was down ~17%; the payoff has not yet arrived. Same country, same buzzword, opposite directions. A headline about one tells you almost nothing about the other.

The case for it

  • Alibaba Cloud +38% YoY (Mar-quarter 2026); AI-related products: 11th consecutive quarter of triple-digit growth; ~30% of external cloud revenue
  • Tencent core operating margin ~43% (ex-AI spend) — the business is genuinely profitable
  • Price war appears to be ending — all three platforms signalled pulling back on subsidies; segment losses narrowed Q1 2026
  • Cheap vs history — the 2021-peak to 2026 drawdown is ~−55%; much of the valuation compression has already happened
  • Lowest fee in class at 0.25% — largest fund, tightest spread among Hang Seng TECH trackers

The case against it

  • Still ~55% below its 2021 peak after 5 years. Someone who bought in 2022 on a "78% upside" research note is still underwater in 2026
  • Four-part bet: companies (real edge) + China economy + Beijing regulatory stance + timing. You only have real edge on the first
  • Distributing, not accumulating — dividends paid as cash twice a year, must be manually reinvested
  • HKD currency layer between you and your ringgit
  • HK-listed, so the Ireland vs US WHT logic doesn't apply — different tax mechanics
  • iFAST 67% upside target depends on two things going right: earnings recovery arriving on schedule AND market re-rating to higher multiples. Treat as scenario, not forecast
  • Overlap trap: Tencent, Alibaba, Meituan already sit in FWRA — buying 3067 on top secretly triples your bet on these exact names
My position — two honest chapters The 2022 entry (the lesson): In 2022 I bought on a "78% upside" research note and was still flat four years later. The phoenix didn't rise. The lesson: "early" is just wrong with a nicer name. I exited that position.

The current position: A separate, smaller, averaged-in satellite built via RSP from mid-2025. Currently around −20% — within the satellite framework's tolerance. The thesis (identifiable, temporary drags; real AI monetisation underneath) is intact. The temptation to "fix" the average cost with extra cash is exactly the wrong reflex — feeding red is not a strategy, it's a panic response. The position gets no additional funding unless I genuinely want to add. The core DCA keeps running, untouched.
Quick reference — 3067
Full nameiShares Hang Seng TECH ETF
ExchangeHong Kong Stock Exchange (FSMOne: 3067)
TER0.25% (lowest among Hang Seng TECH trackers)
DividendsDistributing (semi-annual)
Peak (2021)~10,945
Low (2022)~2,802
Level mid-2026~4,700 (still ~55% below 2021 peak)
iFAST price target7,706 points (~67% upside — attributed to iFAST as projection, not endorsed as fact)
Target basisFair PE 22.5× against projected FY28 EPS — two things must go right over 2+ years

EWJ vs XDJP

A COMPARISON LESSON Two Japan ETFs — same country, completely different bets Additive to FWRA? A comparison lesson — EWJ vs XDJP, same country, different bets

Japan is ~5–6% of the all-world index, but for a deliberate overweight it's worth understanding which Japan you're actually buying. EWJ and XDJP both say "Japan equity" in the search bar. They are two very different instruments.

EWJ — the broad index, wrong wrapper

  • Tracks MSCI Japan — ~200+ stocks, free-float market-cap weighted (size-weighted). Broad, sensible, the "right" index
  • Industrials, carmakers, banks, consumer names — spread across the economy
  • Large fund (~US$16B), long track record since 1996
  • BUT: US-domiciled → 30% dividend WHT on a fund with a meaningful yield; US estate-tax exposure; not accumulating
  • TER: 0.49% — roughly 5× XDJP

XDJP — the quirky index, clean wrapper

  • Tracks Nikkei 225 — 225 stocks, but price-weighted (not size-weighted). Same method as the Dow Jones. A few high-priced names (Tokyo Electron, Fast Retailing, SoftBank) dominate
  • In 2025, just 3 companies drove more than half the Nikkei's annual return
  • BUT: Luxembourg-domiciled (UCITS) → no US WHT layer, no US estate-tax exposure; accumulating preferred
  • TER: 0.09% — roughly 5× cheaper than EWJ
  • ~€2B fund, established 2013, reasonable size
The key lesson. Good index + wrong wrapper (EWJ) vs quirky index + clean wrapper (XDJP). This is the Japan version of the VT vs VWRA question from the core thesis. The domicile and fee win on the things you can actually control — even if it means accepting the Nikkei's price-weighted concentration over the MSCI Japan's sensible broad index. Ideally: find a UCITS ETF tracking MSCI Japan (broad index, clean domicile) — that's better than both options. Check FSMOne for current availability.
General position For a Japanese overweight as a satellite, the wrapper decision matters more than the index choice — for a Malaysian long-term holder. The 30% US dividend withholding on EWJ plus 5× the annual fee is a strange thing to volunteer for when a UCITS alternative exists at 0.09%. The Nikkei's price-weighted concentration is a real quirk, but it's still 225 Japanese companies, and the cost advantage over 20 years is significant. That said: neither fund compounds automatically — both are distributing. For a truly hands-off Japan tilt, the ideal is an accumulating UCITS ETF tracking MSCI Japan. Check current availability on your platform.
EWJ vs XDJP — side by side
EWJ 0.49% vs XDJP 0.09% — same country, 5× the fee
EWJXDJP
IndexMSCI Japan (~200+ stocks, size-weighted)Nikkei 225 (price-weighted, concentrated)
DomicileUnited StatesLuxembourg (UCITS)
TER0.49%0.09%
DividendsDistributingDistributing (semi-annual)
US div. WHT30% (on top of Japan WHT at fund level)None at fund→you layer
US estate taxYesNo
AUM~US$16B~€2B
Launched19962013

Both face Japanese dividend tax at the fund level (unavoidable for any Japan fund). EWJ adds a US layer on top. Figures from provider factsheets, justETF and FSMOne, early-mid 2026; re-check before acting.

Sources & further reading

Sources last checked: mid-2026. Satellite return figures are time-specific — re-verify each fund’s factsheet before acting.

Per-fund specs (index, holdings, TER, domicile) — provider factsheets / justETF

  1. BOTZ — Global X Robotics & AI (globalxetfs.com)
  2. PNQI — Invesco Nasdaq Internet (invesco.com)
  3. BUG — Global X Cybersecurity, US & UCITS (globalxetfs.com)
  4. 3119 — Global X Asia Semiconductor, HK (globalxetfs.com.hk)
  5. GRID / FGRD / GRDU — First Trust Nasdaq Clean Edge Smart Grid (ftportfolios.com)
  6. SHLD (+ ARMR, DFNS, ASWC) — Global X Defense Tech & UCITS defence peers (globalxetfs.com; vaneck.com; hanetf.com)
  7. REMX — VanEck Rare Earth & Strategic Metals (vaneck.com)
  8. 3067 — iShares Hang Seng TECH, HK (blackrock.com)
  9. EWJ / XDJP — iShares MSCI Japan & Xtrackers Nikkei 225 (blackrock.com; etf.dws.com)

Research & data

  1. Thematic ETFs underperform ~6%/yr over their first 5 years. Ben-David, Franzoni, Kim & Moussawi, “Competition for Attention in the ETF Space,” Review of Financial Studies (2023) — available on SSRN.
  2. Global military spending ~US$2.7T (2024). SIPRI (sipri.org).
  3. Data-centre electricity demand outlook. IEA (iea.org); Goldman Sachs Research (goldmansachs.com).
  4. Cybersecurity spending forecast (~$172bn → $562bn) — verify the specific market-research source used (e.g. the industry/Statista report) before publishing the figure.
  5. HK/US fund tax mechanics differ from Ireland-domicile — confirm per fund with FSMOne (fsmone.com.my).

Tools: wisesheets.io/etf-comparison-tool · justETF.com.

Note: all “my position” calls and the overlap %s are the author’s own analysis.

Before you go

One email when the next writeup drops

No spam, no fluff, no affiliate links — just the next durable idea, written as hard on me as on you.

Free to read, always — the whole site, no sign-up. The email is optional.